
Data Engineer Things Newsletter - Data Pulse Edition (June 2026)
How Airbnb created a multi-product compatible data architecture, the 8 engineering metrics AI has broken, why more LLM reasoning effort isn't always better, making Semantic Layer work for AI Agents


Hello Folks,
As data platforms evolve, the hardest problems are no longer purely technical; they’re structural.
How do you maintain consistency as products expand? How do you trust AI-generated outputs without sacrificing governance? How do you measure engineering impact when traditional metrics are being reshaped by automation? And how do you keep increasingly complex systems observable and reliable?
This edition explores how leading teams are tackling these challenges—from data modeling and semantic layers to engineering metrics, observability, and platform design.
– Sukanya
📚 Data Pulse
Scaling Beyond One: How Airbnb Evolved Its Data Architecture for a Multi-Product World
📖 Topic: Data Modeling & Analytics Engineering
🧠 Level: Beginner
Summary: Airbnb began as a single product - home-sharing. As the company expanded into Experiences and Services, the original modeling approach wasn’t enough as the definitions drifted between product lines, the same concepts were modelled differently across teams, and analytics engineers spent increasing time reconciling inconsistencies rather than producing insights. This post describes how Airbnb’s data and analytics engineering teams designed a consistent, flexible data modeling framework capable of spanning multiple product verticals without collapsing into a single rigid schema. And that involves 3 key principles:
No hybrid data models
Consistent identifier naming
Clear namespace organization
And then the modelling guidelines as a framework for every domain team to use in analyzing their specific situation
💡 Why is this relevant for DEs?
The single-product-to-multi-product transition is a forcing function for data modeling discipline. Teams that got away with informal modeling conventions in the early days often hit this wall when the business expands. This post is a useful reference for how to think about the transition before it becomes a crisis.
The consistency-vs-flexibility tension is the core data modeling challenge. Airbnb’s frames it shared definitions at the core, product-specific extensions at the edges. It is a pattern that generalises well beyond their specific domain. It’s a practical answer to the question of how much standardisation is too much.
Analytics engineers and data engineers will both find value here. The post covers both the modeling decisions (which sit closer to analytics engineering) and the platform choices that make those decisions enforceable at scale (which sit closer to data engineering). It’s one of the better cross-functional treatments of the topic.
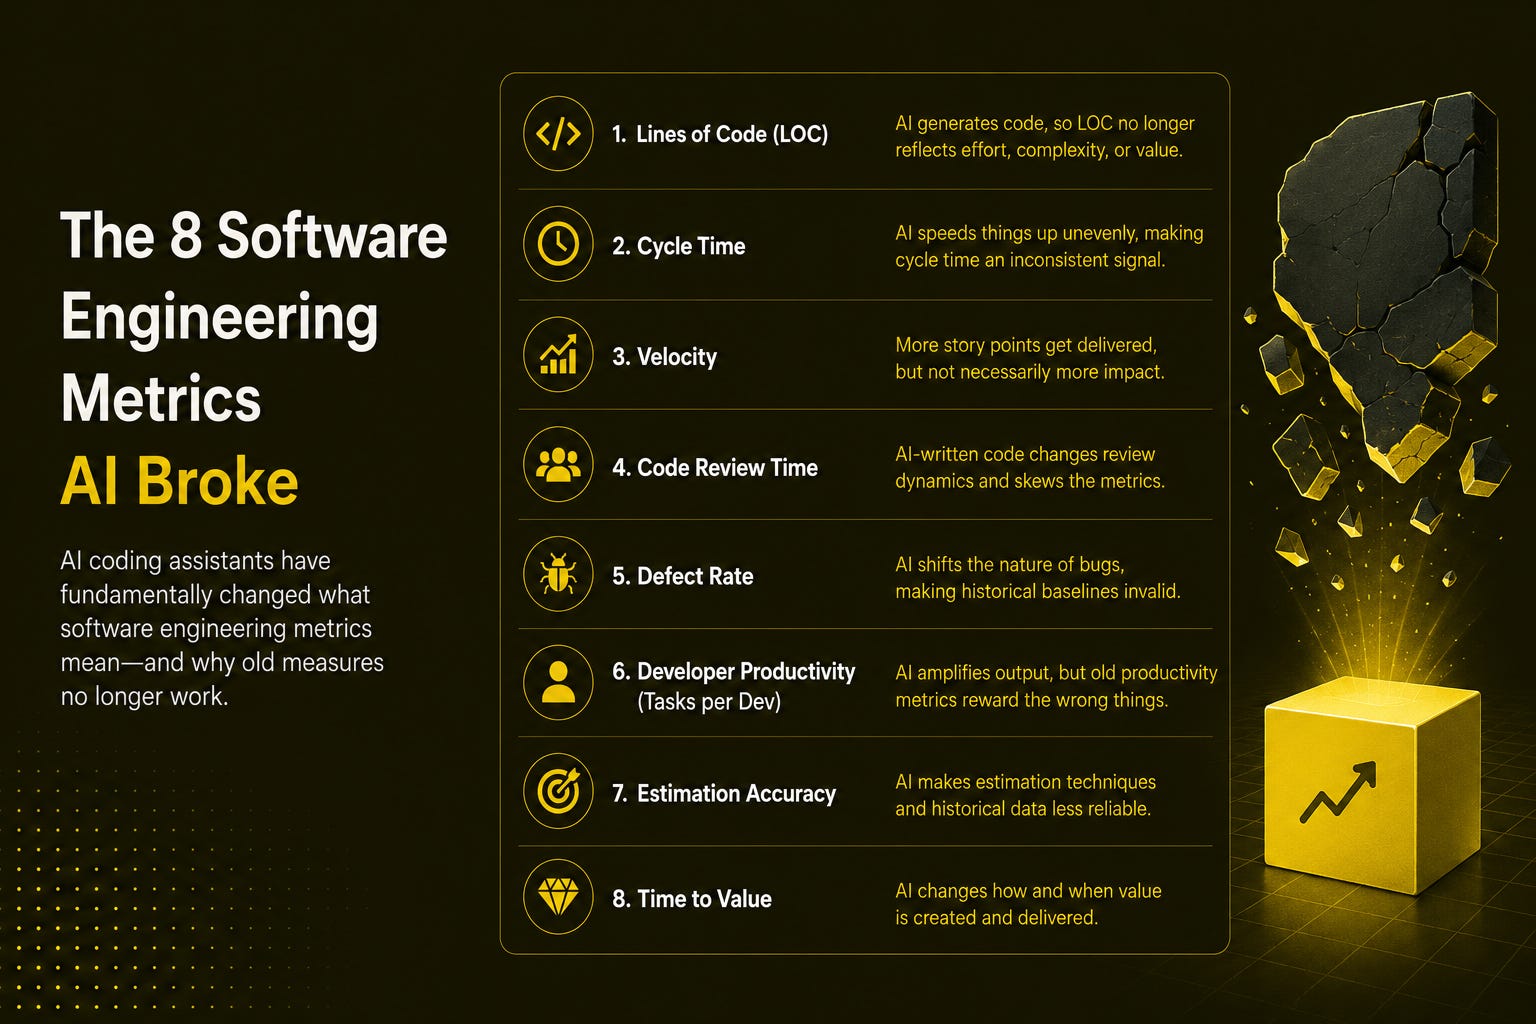
The 8 Software Engineering Metrics AI Broke
📖 Topic: Engineering Metrics & Measurement in the AI Era
🧠 Level: Beginner
Summary: LeadDev’s June 2026 article makes a simple but uncomfortable argument: most of the metrics engineering teams rely on like deployment frequency, cycle time, PR volume, test coverage, lines of code were built on the assumption that human effort and output move roughly in proportion. AI coding tools have broken that assumption. A developer with an agent can ship multiple PRs in a day without any improvement in engineering maturity; cycle time compresses while technical debt accumulates; test coverage written by the same model that wrote the code means something different than it used to. The article walks through eight specific metrics that have been distorted or invalidated, and identifies three that still hold up with a clear explanation of why.
💡 Why is this relevant for DEs?
Data engineering teams use these same metrics. Pipeline deployment frequency, time-to-merge for data model changes, test coverage on dbt models all of these are subject to exactly the same distortions the article describes. If your team is measuring AI productivity using pre-AI proxies, the numbers are probably misleading you.
Goodhart’s Law has always applied; AI makes it effortless. Gaming metrics used to require deliberate effort. With AI coding tools, inflating deployment frequency or PR volume is a side effect of normal use, not a sign of bad intent. That changes how you need to think about metric design entirely.
The three metrics that still hold up are worth identifying for your own stack. The article’s affirmative case of what to measure instead is the most actionable part and gives you a starting point for rebuilding dashboards that remain meaningful in an AI-assisted engineering environment.
How to Make Semantic Layer Work for Analytics Agents
📖 Topic: Semantic Layers & AI Analytics
🧠 Level: Intermediate
Summary: This piece explores why semantic layers are becoming foundational infrastructure for AI agents interacting with business data. Instead of letting LLMs generate raw SQL directly against warehouses (which often leads to inconsistent metrics, hallucinated joins, and governance issues), the article argues for exposing curated business logic through a semantic layer. It walks through how metrics definitions, entity relationships, dimensions, and governance rules can be standardized so AI agents operate on trusted abstractions rather than raw tables. The post also explains how semantic layers improve discoverability, consistency, and interoperability across modern analytics stacks while enabling more reliable natural-language querying.

💡 Why is this relevant for DEs?
This is one of the clearest explanations of why semantic layers matter again in the AI era. For years, semantic layers were treated as a BI concern. Now they’re becoming the control plane between LLMs and enterprise data systems. If your company is experimenting with AI-powered analytics, this architectural shift is worth understanding early.
The article highlights a practical reality many teams are already facing: AI-generated SQL is only as reliable as the metadata and governance underneath it. Centralized metrics definitions, entity modeling, and governed dimensions are what prevent agents from producing contradictory answers across dashboards and chat interfaces.
The interoperability angle is especially important. As more organizations adopt tools like dbt, MetricFlow, Cube, AtScale, or Looker semantic models, the semantic layer increasingly acts as a shared contract between analytics engineers, BI tools, and AI systems. Understanding this pattern will likely become a core skill for modern data engineers and analytics engineers alike.
And this LinkedIn thread is worth a read.
The Evolution of Cassandra Data Movement at Netflix
📖 Topic: Operational Data Movement & Lakehouse Ingestion
🧠 Level: Intermediate
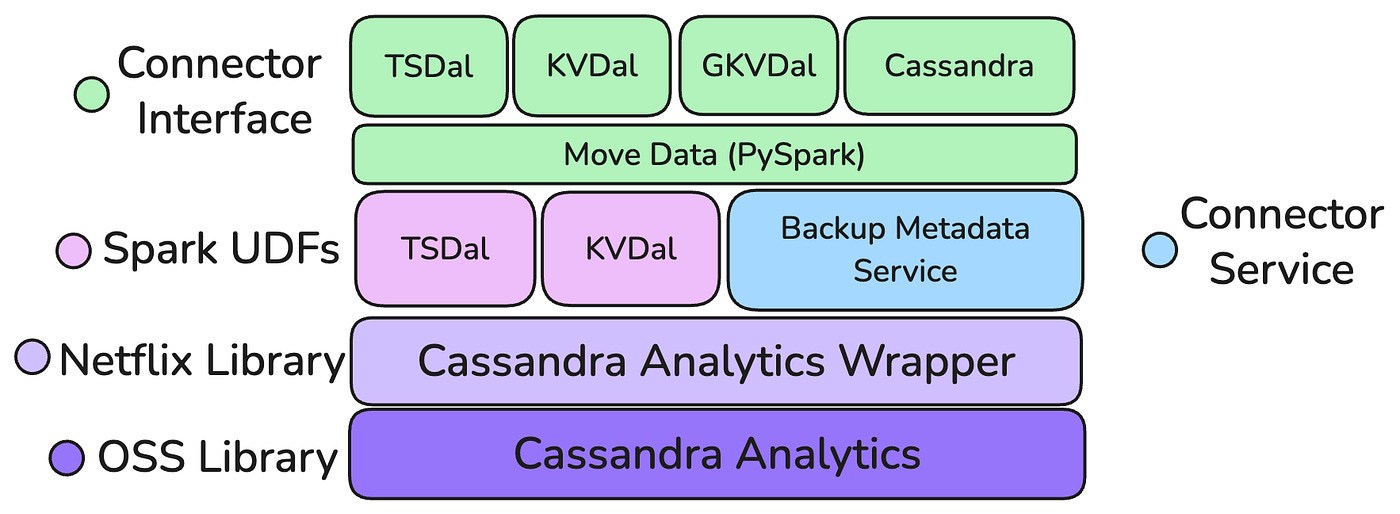
Summary: Apache Cassandra powers mission-critical systems at Netflix: Member, Billing, Recommendations, Subscriptions. Moving that data into Apache Iceberg for analytics has always been a core need, handled for years by an in-house connector called Casspactor. But as Netflix built higher-level abstractions on top of Cassandra - Key Value, Time Series, and Graph, the movement requirements grew more complex: transformations became necessary, schemas became non-trivial to map, and a single connector was no longer sufficient. This post walks through how Netflix evolved their Cassandra-to-Iceberg data movement architecture from a basic export connector to a more capable, abstraction-aware system that handles the full range of Cassandra-based data models and how it all sits within their broader Data Bridge platform.
💡 Why is this relevant for DEs?
The operational-to-analytical bridge is a problem every production data team faces. Cassandra is widely used for transactional workloads; Iceberg is increasingly the standard for analytical storage. How you move data between them reliably, at scale, with schema fidelity matters a great deal. Netflix’s approach is one of the more detailed public accounts of how to do it.
The evolution story is the valuable part. The post doesn’t present a finished system it shows how a connector built for one abstraction layer had to be redesigned as new abstractions emerged above it. That pattern of “the infrastructure you built for today’s complexity doesn’t survive tomorrow’s” is something worth understanding structurally than just technically.
Brain the Size of a Planet: Are LLMs Thonking Too Hard?
📖 Topic: LLM Reasoning Effort & Practical Model Selection
🧠 Level: Advanced
Summary: Security researcher Parsia Hakimian ran a rigorous empirical experiment across 26 combinations of Claude 4.6/4.7 and GPT-5.4/5.5 models varying reasoning effort levels (low, medium, high, xhigh) and context window sizes to test how well LLMs triage real security vulnerabilities. The results challenge a widely held assumption: higher reasoning effort is not always better, and later models don’t uniformly outperform earlier ones. GPT-5.5-medium outperformed high and xhigh on several tasks; full solve rates were nearly zero (1.9%) across all models; and a four-LLM triage council with majority voting: 86.2% unanimous agreement performed far more reliably than any single model. Total experiment cost: roughly $9,200. The methodology is detailed, reproducible, and the data is publicly available on GitHub.
💡 Why is this relevant for DEs?
The “more reasoning = better results” assumption needs questioning in data contexts too. If you’re building LLM-powered pipeline generation, metadata enrichment, or data quality classification, the implication is important: defaulting to maximum reasoning effort increases cost and latency without a guaranteed quality improvement. The right effort level depends on the task structure, not a general rule.
The council/ensemble approach is a practical architecture pattern. Rather than trusting a single model call, running the same task across multiple models with majority-vote reconciliation is a concrete technique for improving reliability in agentic data workflows particularly for high-stakes decisions like anomaly classification or schema change validation.
Function-level context significantly outperformed file-level context. Giving the model exactly the code or data schema it needs rather than dumping an entire file produced dramatically better results. This maps directly to how data engineers should be structuring prompts when using LLMs to reason about pipeline logic or data contracts: smaller, precise context wins.
💎 Open Source Gem
Viaduct 1.0 — Airbnb’s Production Data Mesh, Now Open Source
Viaduct is Airbnb’s data mesh platform: a system for registering, discovering, and governing data products across a distributed, domain-owned data organisation. It handles the hard parts of data mesh: how do domains publish data products in a way that others can discover and trust? how does the platform enforce quality standards without centralising ownership? Without prescribing a fixed architecture for every team. The 1.0 release (May 2026) marks the transition from an internal Airbnb tool to a publicly maintained open-source project.

📰 What’s in 1.0
The initial open-source release includes the core data product registry, a quality enforcement layer that runs checks at registration and on a configurable schedule, a discoverability API and UI for finding data products across domains, and an access governance model that delegates ownership decisions to domain teams while maintaining platform-level audit trails. The CLI supports YAML-based product definitions (as above) as well as programmatic registration via Python and Go clients. Airbnb’s own internal deployment manages several hundred registered data products across dozens of domains.
💡 Why is this useful for DEs?
It’s the first serious open-source reference implementation of data mesh at production scale. OpenMetadata and DataHub handle catalog and discovery well; Viaduct handles the harder problem of how data products are governed and owned across a distributed organisation, not just catalogued.
The YAML-first product definition is approachable for small teams. You don’t need to adopt the full data mesh paradigm to get value from Viaduct’s quality and ownership primitives. Teams can start with a single domain and a handful of registered products and scale from there.
Quality enforcement at registration time changes the dynamic. Rather than discovering data quality issues downstream when a consumer’s pipeline breaks, Viaduct’s check-at-registration model means problems surface when the producer publishes — which is the right place to catch them.
👉 GitHub: https://github.com/airbnb/viaduct
💡 DE Tip of the Month
Improving Data Observability in AI-Assisted and Agent-Driven Pipelines (Snowflake, Databricks, BigQuery)
As data platforms become more dynamic, with dbt transformations, LLM-generated queries, and agent-driven workflows, traditional pipeline monitoring is no longer enough. In Snowflake, Databricks, and BigQuery, failures often don’t show up as broken jobs but as silent data quality drift or unexplained downstream inconsistencies.
📒 Rules of thumb
Instrument data at the query and job level, not just pipeline level.
In Snowflake, use the information schema and QUERY_HISTORY to trace execution patterns. In Databricks, rely on system tables and job run metadata. In BigQuery, use job history and audit logs. Observability starts at execution granularity, not DAG-level success/failure.Track data lineage across transformations, especially in automated workflows.
In Snowflake Dynamic Tables, dbt models, and Databricks Delta Live Tables, ensure lineage is explicitly captured so AI-generated or scheduled transformations don’t create “orphan” datasets.Monitor data drift, not just pipeline failures.
In modern systems, pipelines can succeed while outputs become incorrect. Add checks for schema drift, distribution shifts, and freshness anomalies across all three platforms.Separate human-authored vs. agent-generated transformations.
AI-assisted SQL and automated transformations should be tagged and tracked separately to understand where unintended changes originate.Centralize observability signals outside the warehouse.
Don’t rely solely on Snowflake/Databricks/BigQuery logs. Push metadata into a unified observability layer so lineage, freshness, and quality signals can be correlated across systems.
📊 Community Poll
Until the next one.
ℹ️ About Data Engineer Things
Data Engineer Things (DET) is a global community built by data engineers for data engineers. Subscribe to the newsletter and follow us on LinkedIn to gain access to exclusive learning resources and networking opportunities, including articles, webinars, meetups, conferences, mentorship, and much more.