
Data Engineer Things Newsletter - Community Spotlight Edition (Feb 2026)
A non-traditional path into data and how frustration with monolithic BI tools became a career in building them


Hi everyone,
This interview highlights how diverse backgrounds and perspectives help people build better data tools.
I met Archie through a virtual data conference called MDS Fest where he introduced Evidence as an open-source reporting tool using only SQL and Markdown (source). What stood out to me was his non-traditional path in data moving from strategy consulting to building open-source data tools. Spending years translating raw data into business decisions gave Archie a deep perspective on how data actually gets used, and where data tools might often get in the way.
Since then, he’s been active in the open-source community shipping data tools, and he’s now leading growth at Evidence.
Hope you find the lessons from this conversation meaningful.
Let’s go!
— Eddy
Spotlight: Archie Wood (Head of Growth at Evidence)
“Someone has to fix this and I’d like to be part of that solution”
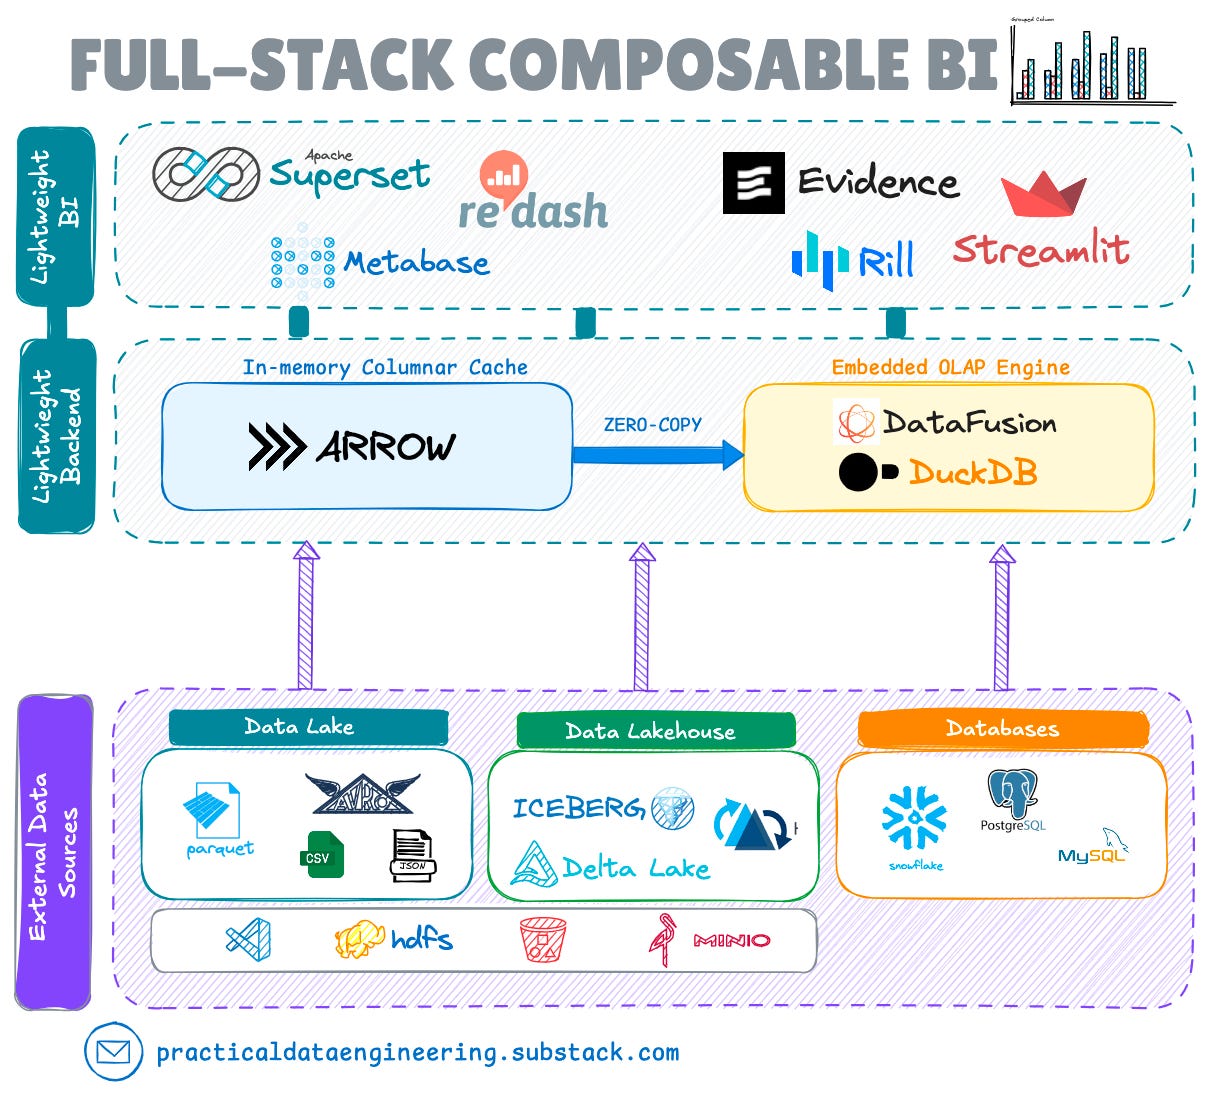
For years, BI meant expensive, monolithic systems that stifled adaptability. But as data environments grew more complex, the demand for flexibility exploded.
This shift has driven the rise of composable BI. Instead of a “black box”, modern stacks use decoupled components to give teams total control over their metrics and visuals.
It was exactly this frustration with the “old way” that pushed Archie Wood (Head of Growth at Evidence) to move from analyzing data to building the tools behind it. His path is anything but traditional, and his story reveals a lot about where modern BI is heading.
📊 Sponsored Insight: The State of Airflow 2026 Report

The State of Apache Airflow 2026 Report, the largest data engineering survey ever, draws on insights from 5,800+ data engineers on how Airflow is actually being used today. In this report, you’ll learn:
How the role of the data engineer is evolving
How early adopters are leveraging Airflow 3 features
How orchestration-first teams tend to ship AI to production faster
👉 Read the report HERE
(This message is sponsored by Astronomer.)
Could you walk us through your journey into the data engineering space?
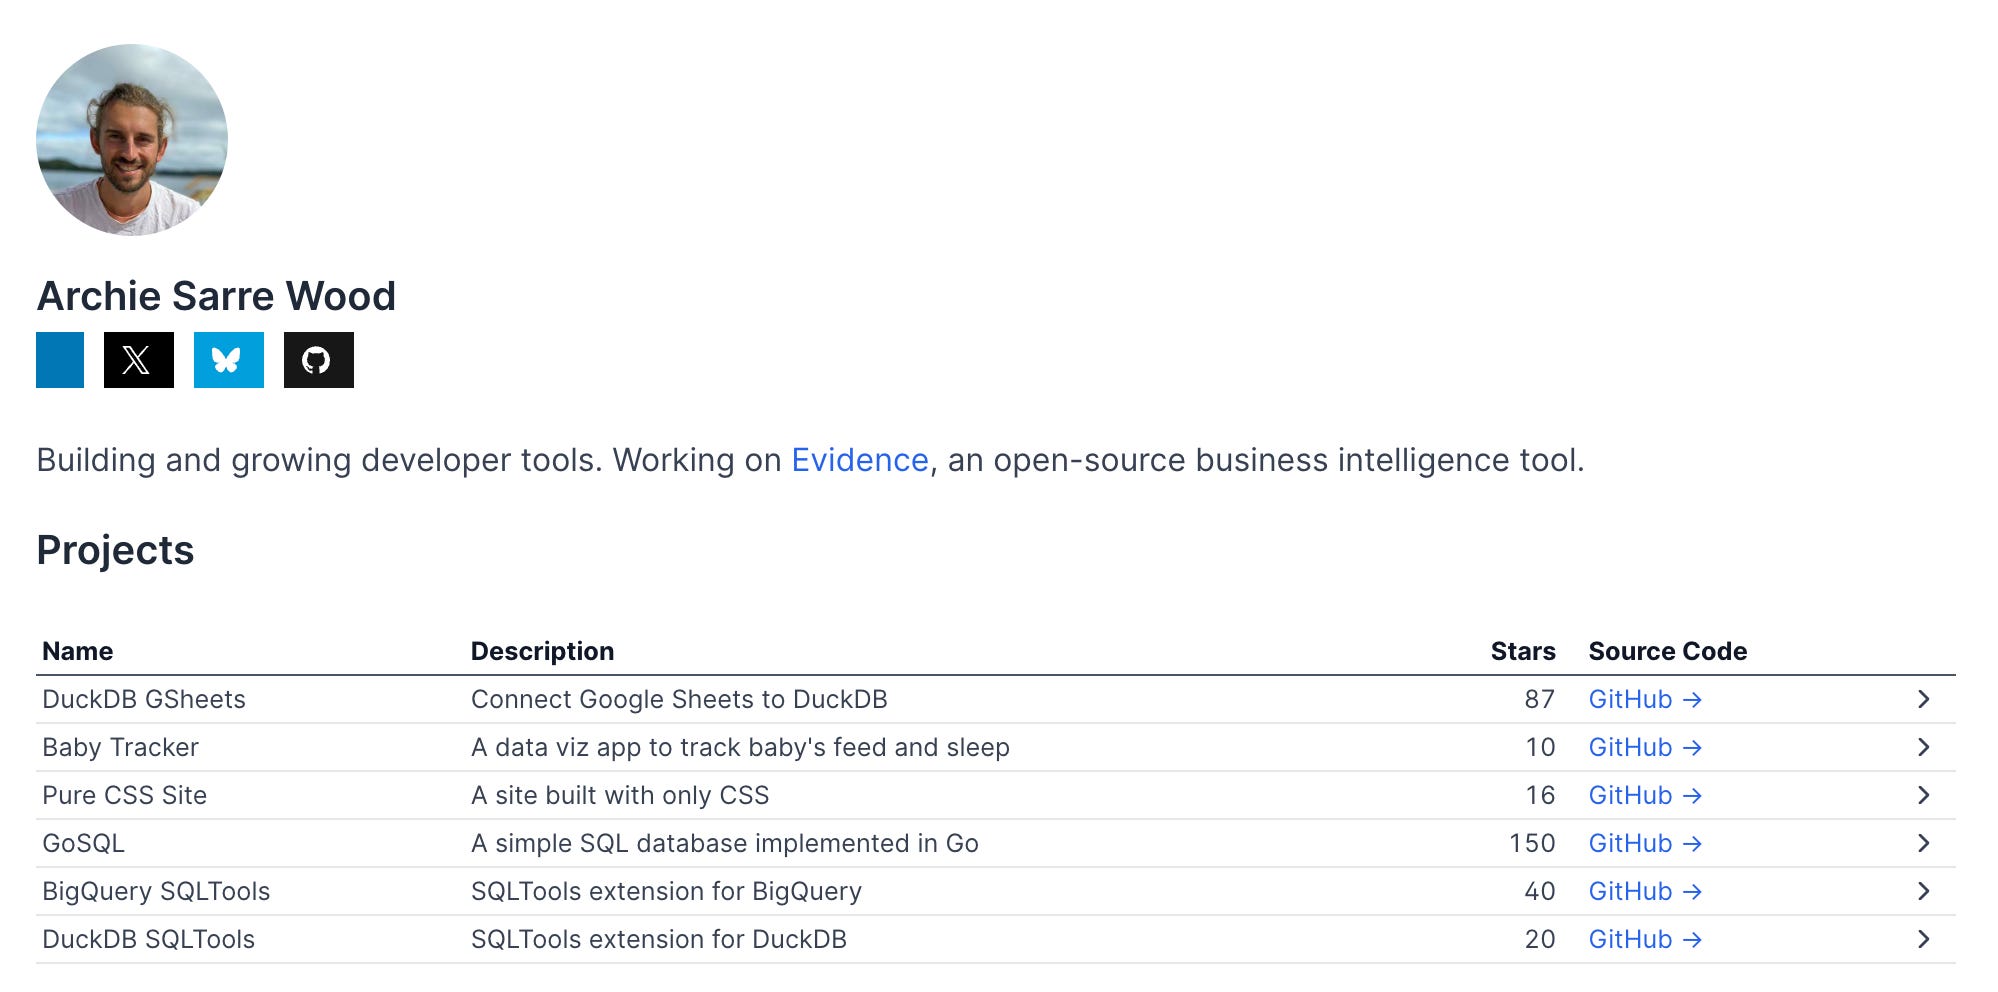
Today I work as an open-source maintainer and lead growth for a BI tool but I got here by being deeply frustrated as a non-technical data user.
I maintain several open-source projects (DuckDB GSheets and gosql) on top of Evidence because I’ve lived the pain of data tools getting in the way of insights.
I’ve been working with data for about 8 years, though I came into data in a non-traditional way. I started in management consulting, where data was mainly used to make slides and working on Excel until it fell over at a couple hundred thousand rows. Tableau opened my eyes to what better BI tools could do, and I was hooked.
Later, I joined an e-commerce company in London called Patch Plants (UK houseplant retailer) as Strategy Manager and eventually Chief of Staff where I learned SQL and Python because I kept pestering the data team for requests. They eventually gave me developer access and let me self-serve. We used Snowflake, dbt, Looker, Metabase and a lot of Google Sheets. It was a wild couple of years. Between 2019 and 2021, Patch grew nearly 200% and delivered over a million plants to 300,000 customers. Being part of that growth while building out the BI function while navigating complex challenges like Brexit was an incredible learning experience.
In 2021, I moved to Canada and spent a bit of time working on my own data startup ideas, but nothing really stuck. Eventually, I met Adam and Sean, the founders of Evidence who were building exactly what I’d always wanted, a more flexible BI tool that gave you more control over visuals. It often felt like the BI software I used was slowing me down more than helping me and I remember thinking, “Someone has to fix this and I’d like to be part of that solution”. I traded SQL and spreadsheets for building code extensions that made it easier for data folks to tell data stories using software engineering principles.
💡 Key takeaway: Non-traditional paths into data are a superpower. Firsthand frustrations coupled with domain expertise become the fuel to build better data tools.
As an open source maintainer and Head of Growth at Evidence, how do you balance the engineering mindset with the community and adoption side of the work?
It comes in waves. Some months I’m deep in code, shipping features non-stop. Other months are more about storytelling and figuring out how to explain what we’ve built, who it’s for, and where it fits.
A big part of making that balance work is being clear about who we’re talking about when we say “users”, because we have two different audiences.
Our open-source product is something teams can self-host and deploy as a static site. The source code is fully public on GitHub, and the community around it includes contributors, maintainers, and people using it in production on their own infrastructure.
Evidence Studio is our commercial SaaS product and while it isn’t open source, we’re still working out whether we may open source parts of it over time.
When you’re balancing engineering, customer success, and an open-source community, empathy matters a lot. In open source especially, it’s easy to think “people are using it wrong,” but most of the time it means we designed something with too much friction. Evidence initially required installing Node.js and managing local dependencies, which worked fine for contributors but was a blocker for a lot of non-technical users. As a result, we’ve built a browser-based experience to make onboarding smoother and collaboration easier, while maintaining core functionality.
Keeping the project authentic to its open-source roots is a constant balance, and it’s not always straightforward. One way we’ve supported open-source development is by offering commercial support services for teams self-hosting the open-source version. Bigger enterprises often want the ability to pick up the phone and resolve issues quickly, and that support helps fund the work while keeping the open-source project healthy.
💡 Key takeaway: Balancing engineering and community comes down to empathy. Data engineers need to listen to users, understand their real needs, and remove friction wherever possible.
On a personal level, you’re balancing building tools, growing a community and parenting. What habits or systems have helped you sustain creativity and focus amid that mix?
I’m still early in parenting days so any “system” I have keeps changing. Kids force you to adapt constantly. My partner and I both work full time, and because she’s based in New York, I handle weekdays and she takes weekends. It’s intense, but it works.
I run my days in blocks: mornings and evenings are family time, the core workday is protected, and nights are for decompression or light work. Startups don’t respect schedules and if something breaks, you jump in but parenting has made me ruthless about focus. You quickly see how much time gets wasted otherwise.
💡 Key takeaway: It’s important to be intentional with time management and adaptability. Knowing when to pivot is crucial to staying productive and effective.
What’s something you’ve learned from the Evidence community that changed your thinking about how open-source BI should evolve?
BI tools are deceptively complex pieces of software. Setting one up can take weeks, and the person doing it usually has three other jobs. They might be a data engineer, director of data, or even a software developer doing BI on the side. By the time they’ve cleaned and modelled their data, users just want a tool that helps them explore and visualize it without the complex setup time.
That gap between lightweight data exploration (querying in SQL or using a notebook) and building polished dashboards is still massive. It shouldn’t be. Most people want something that feels as quick and flexible as a notebook or SQL client, but with the clarity and polish of BI.
That’s where open source really shines. It can move faster, stay flexible, and meet people where they already work. Projects like Evidence, Streamlit and Rill Data live in that middle ground between exploration and presentation. Where you can go from query to insight to something you’re proud to share, without waiting on a whole implementation cycle.
💡 Key takeaway: There’s a distinct product niche for BI tools that can offer out of the box data exploration and BI tools which provide well governed dashboards.
You mentioned other open-source projects (Streamlit, Rill) that sit in this middle ground. As a data engineer, how do these compare to Evidence, and when should one choose which tool?
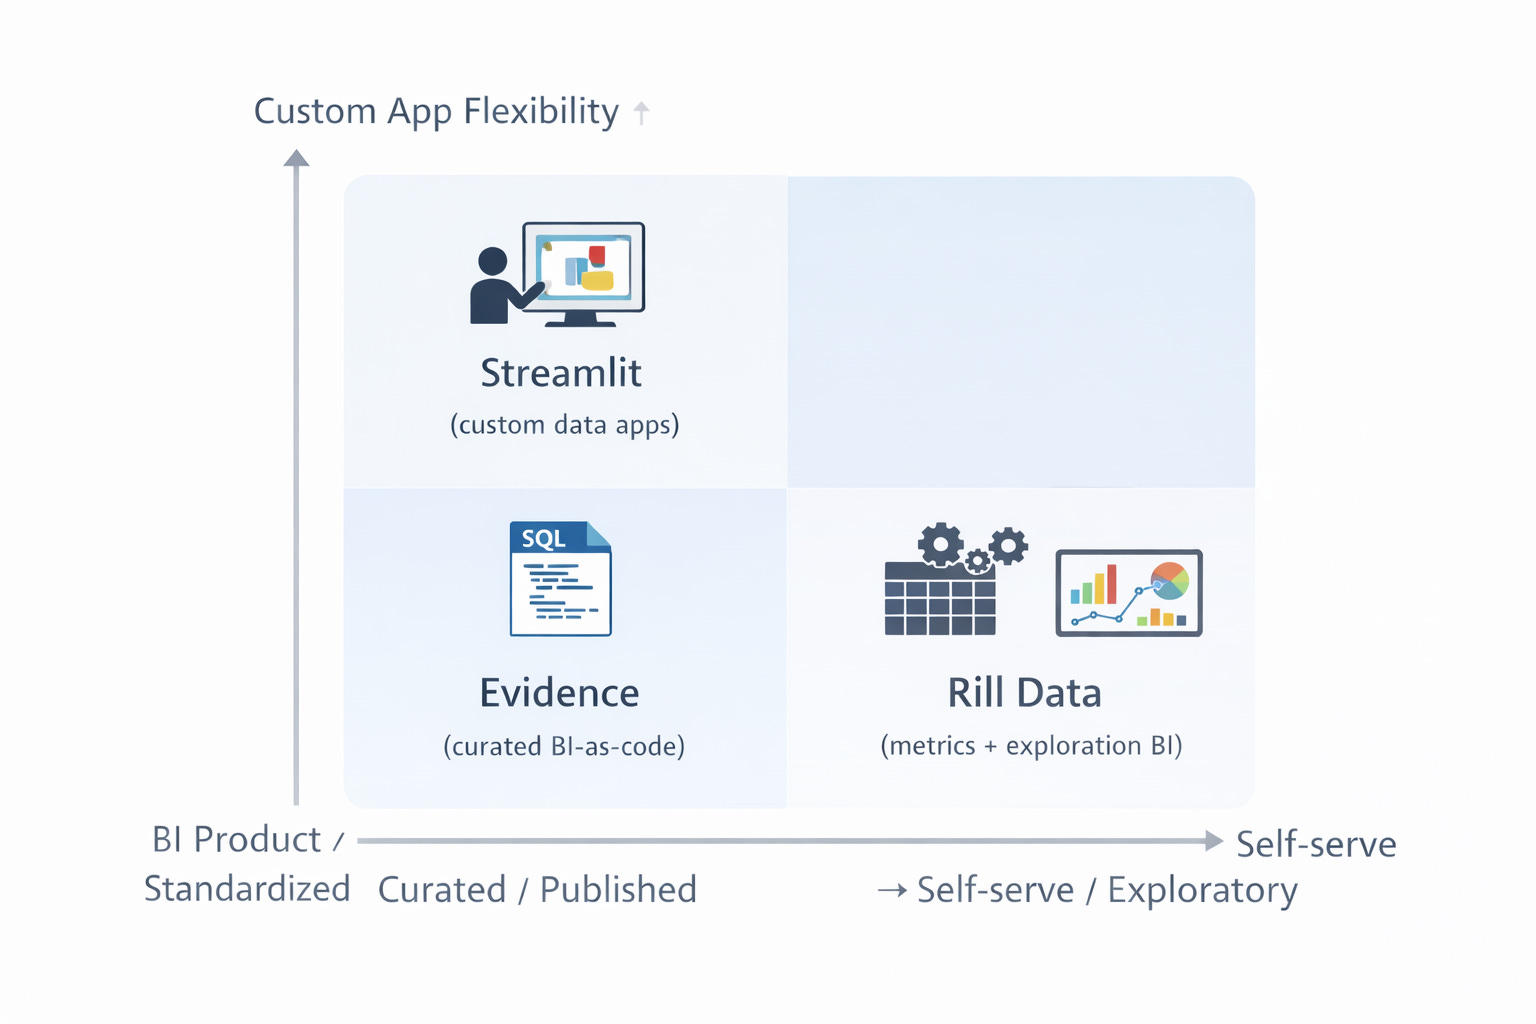
Evidence is the most analytics-engineering friendly if your goal is trusted reporting as code. It’s SQL-first and Markdown-first, so dashboards behave like software artifacts: version controlled, reviewable in PRs, reproducible across environments, and easy to ship as a static site or data product. It’s especially strong when you want to pair charts with narrative and definitions (“what changed, why it changed, and what to do next”).
Streamlit is best thought of as a Python application framework, not a BI tool. It’s ideal when you need more than charts (custom workflows, business logic, forms) and UI needs to be bespoke. The tradeoff is governance isn’t built in: metric definitions, permissions, consistency, and performance patterns are on your team to implement. It’s great for prototyping, but can become “a collection of apps” without standards.
Rill is closer to a productized BI experience: fast dashboards, metrics-driven exploration, and workflows optimized for operational analytics and drill down analysis. It shines when you want a Looker-style experience without building an app. Compared to Evidence, it’s less about narrative reporting and more about interactive exploration with an opinionated structure for speed and consistency.
Rule of thumb:
Choose Evidence for governed, version-controlled reporting with narrative.
Choose Rill for fast metrics + interactive exploration with a BI-product feel.
Choose Streamlit when you need a custom data application, not just dashboards.
Was there a specific GitHub issue or a discussion on a PR that provided a distinct technical learning moment you can share?
One small example that stuck with me was number formatting. A user opened a GitHub discussion pointing out that our default format:
€1,234.56 was incorrect!
In Germany, the same number should be displayed as:
1.234,56 €
That difference matters:
Comma for decimals (,56)
Period for thousands (1.234)
Currency symbol at the end (€)
The user could technically “fix” it upstream in the database layer, but that would turn the number into a string and break Evidence features like charts and numeric props. This edge case required a code change to support locale-aware formatting properly.
It was a good reminder that small details can impact clarity and trust, and we only caught it because someone raised it publicly on GitHub.
💡 Key takeaway: Open source makes your blind spots visible. Real users surface real-world edge cases that make the product better for everyone.
What advice would you give to data engineers who are curious about building open source tools?
Start by contributing. If you use an open source tool and spot a bug or a feature gap, engage with the community on GitHub, Slack, or Discord. Small contributions are the best way to learn how open source really works: people building in public, improving tools they rely on, and collaborating across the world.
If you want to build your own open source tool or company, go in with equal parts excitement and realism. It’s deeply rewarding but hard to sustain. You’ll meet amazing contributors and a few demanding users, and you’ll eventually face the hardest question which is how to monetize without breaking what makes it open.
💡 Key takeaway: Start small and engage the open source community on public channels.
Community poll
💬 How to stay connected
ℹ️ About Data Engineer Things
Data Engineer Things (DET) is a global community built by data engineers for data engineers. Subscribe to the newsletter and follow us on LinkedIn to gain access to exclusive learning resources and networking opportunities, including articles, webinars, meetups, conferences, mentorship, and much more.
Brilliant piece on how real-world pain becomes the best teacher in data tooling. The progression from pestering data teams to buidling open-source extensions is something alot of us can relate to. I've seen similar patterns where operations folks get database access and quickly outpace what legacy BI tools can handle, especially when governance needs clash with exploration speed. The comparison between Evidence, Streamlit, and Rill is super useful btw.